Late last week ATTOM Data Solutions released their Midyear 2018 U.S. Foreclosure Market Report which showed continued progress in the nation’s struggle with distressed properties. In the first half of the year foreclosure activity was 15% lower than in 2017. Nevertheless, some areas of the country are seeing increases and Daren Blomquist, senior vice president with ATTOM Data Solutions, sounded a cautionary note:
Localized foreclosure flare-ups in the first half of 2018 can no longer be blamed on legacy distress left over from the last housing bubble given that nearly half of all active foreclosures are now tied to loans originated in 2009 or later and given that the average time to foreclose plummeted in the first two quarters of the year. Instead these local foreclosure increases are typically the result of more recent distress triggers in those markets.
We’re also seeing early evidence of gradually loosening lending standards starting in 2014, specifically for FHA-backed loans. The foreclosure rate on FHA loans originated in 2014 and 2015 has now jumped above the average FHA foreclosure rate for all loan vintages — the only two post-recession vintages with foreclosure rates above that overall average.
As Daren mentioned, the time required to complete foreclosures has finally started to decline after steadily increasing to absurd levels for more than a decade. See the graph below. This should help us work through the backlog of distressed properties more efficiently.

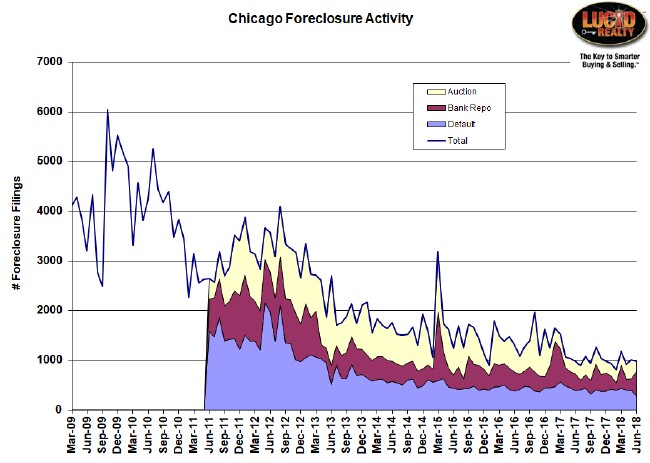
In the second quarter of 2018 foreclosure activity was below pre-recession levels in 55% of the nation’s metro areas. Chicago foreclosure activity was highlighted in the report as being 25% below those levels. The graph below provides some historic perspective on this, beginning with 2009 in the middle of the recession.
Note that in June both auctions and defaults hit new lows since I’ve been tracking the data, while bank repossessions hit the highest level in 8 months. A low level of defaults is encouraging because that means the pipeline is being filled slower, while bank repossessions and auctions help empty the pipeline. Overall activity was about the same as it was a year ago but my hope is that the pipeline is nevertheless depleting.
Chicago Shadow Inventory
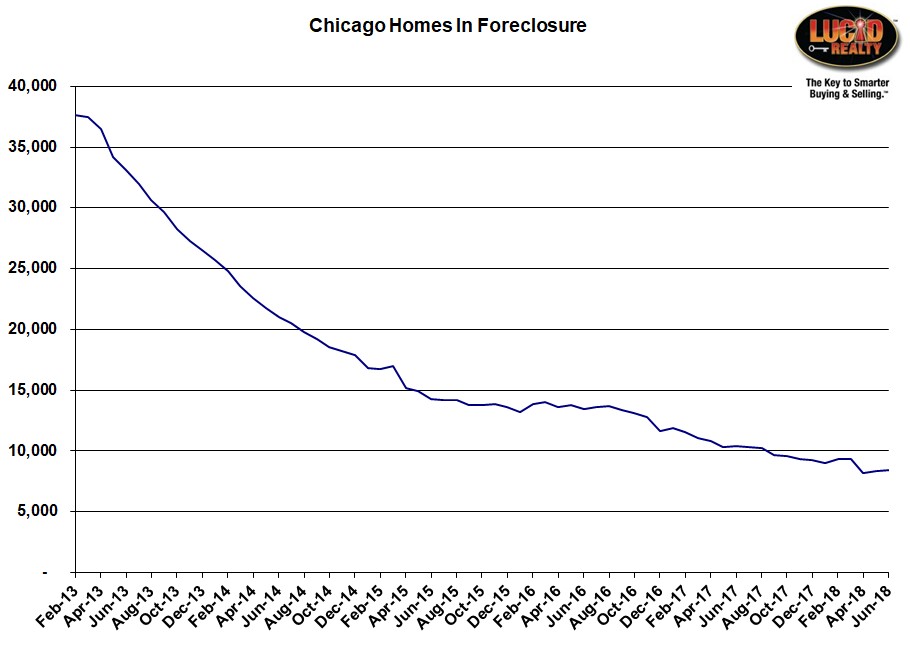
RealtyTrac does give us the data to track the progress of homes in the pipeline (shadow inventory). Unfortunately, that number has actually increased slightly in the last two months but you can see the general progress being made in the graph below. Since last year we have actually cleared out close to 2000 homes.
#Foreclosures #ChicagoForeclosures
Gary Lucido is the President of Lucid Realty, the Chicago area’s full service discount real estate brokerage. If you want to keep up to date on the Chicago real estate market, get an insider’s view of the seamy underbelly of the real estate industry, or you just think he’s the next Kurt Vonnegut you can Subscribe to Getting Real by Email using the form below. Please be sure to verify your email address when you receive the verification notice.

