On Tuesday ATTOM Data Solutions released their July Foreclosure Market Report, pointing out that foreclosure starts for the nation as a whole increased from the previous year for the first time, following 36 consecutive months of decreases. This increase was seen in 44% of the metro areas that they analyze. They provided this heat map that shows areas with large increases in foreclosure starts over last year. You can click on it for a larger version.

According to Daren Blomquist, senior vice president with ATTOM Data Solutions, this increase in foreclosure starts could be the beginning of a trend:
The increase in foreclosure starts is not just a one-month anomaly in many local markets given that July represented the third consecutive month with a year-over-year increase in 33 metro areas, including Los Angeles, Miami, Houston, Detroit, San Diego and Austin. Gradually loosening lending standards over the past few years have introduced a modicum of risk back into the housing market, and that additional risk is resulting in rising foreclosure starts in a diverse set of markets across the country. Most susceptible to rising foreclosure starts are affordability-challenged markets where homebuyers are more financially stretched and markets with some type of trigger event such as a natural disaster or large-scale layoffs.
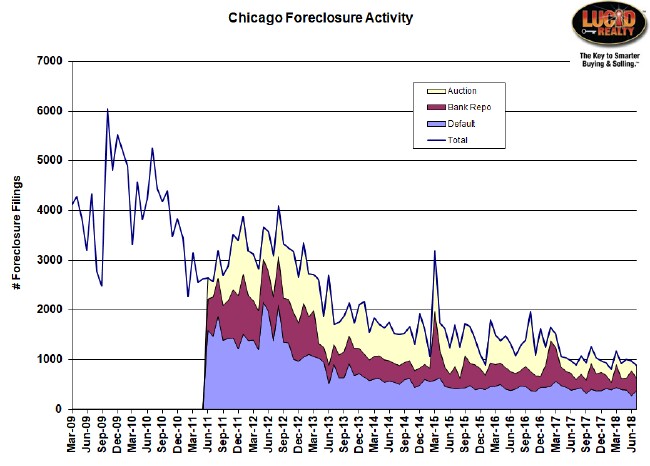
Although the map makes it look like the Chicago area is experiencing an increase in foreclosure starts that’s really not the case. My graph below tracks the 3 components of Chicago foreclosure activity and July defaults (also known as foreclosure starts) were actually down slightly from last year. Total foreclosure activity was at the lowest level in 5 months but barely lower than last year. As you look at the graph you can plainly see that the long term downward trend in foreclosure activity has really bottomed out.

Chicago Shadow Inventory
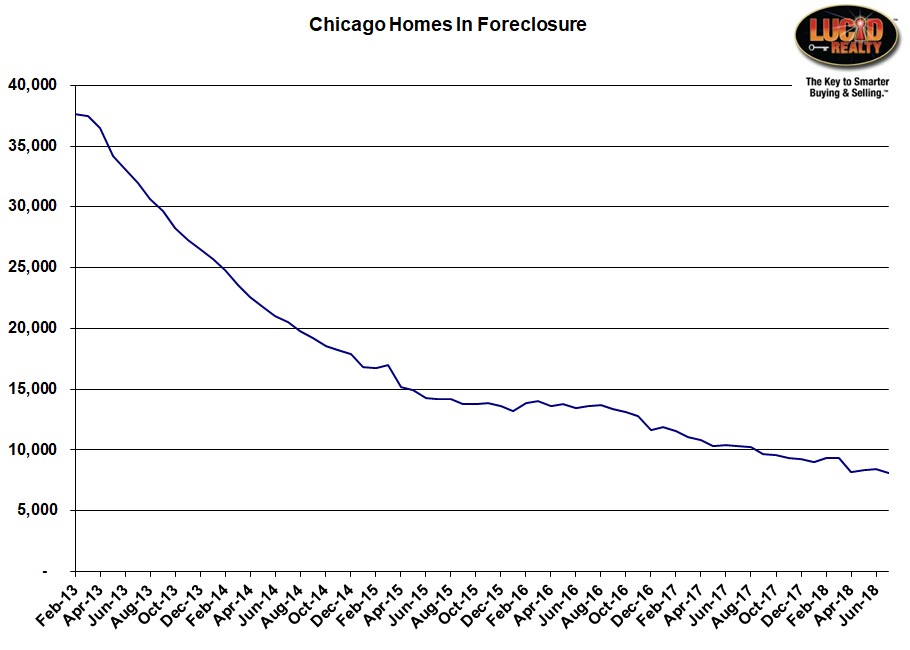
The good news for Chicago is that the single most important number – the backlog of homes in the foreclosure process – declined once again after rising two months in a row. In July this shadow inventory hit a new low since I’ve been tracking the data – 8114 units – which is why the distressed share of total sales keeps declining.
#Foreclosures #ChicagoForeclosures
Gary Lucido is the President of Lucid Realty, the Chicago area’s full service discount real estate brokerage. If you want to keep up to date on the Chicago real estate market, get an insider’s view of the seamy underbelly of the real estate industry, or you just think he’s the next Kurt Vonnegut you can Subscribe to Getting Real by Email using the form below. Please be sure to verify your email address when you receive the verification notice.
