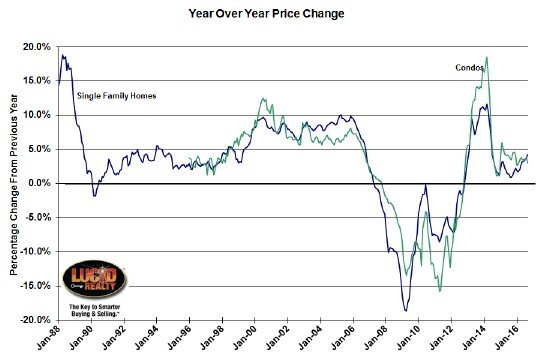
S&P CoreLogic released the September Case Shiller home price index this morning for the nation and 20 metro areas including the Chicago area. The Case Shiller Chicago home price index for single family homes in the area recorded the highest year over year gain in 27 months – up 4.3% from last September. As a point of reference, the revised year over year gain for August now stands at 3.8% so this is a healthy improvement that is long overdue, given how low home inventories have been for so long.
September marks 47 months in a row of home prices increasing from the prior year and 7 months of increasing gains from the prior year.
Condo prices were up only 3.1% from last year at this time, which is the lowest year over year gain in 7 months but, as you can see in the graph below, condo price gains have been exceeding the gains in single family homes for many months prior to this. The lines crossed a couple of months ago.
As has been the case for quite a while now Chicago area home price gains are still lagging most of the rest of the country. Out of 20 metro areas we are tied with Boston for 5th from last place. For instance home prices in the nation as a whole are up 5.5% from last year.
Case Shiller Chicago Home Price Index By Month
The Chicago area’s September home price index was essentially flat vs. August but condo prices did decline by 1.0% from last month. A decline at this time of the year is not unusual though.
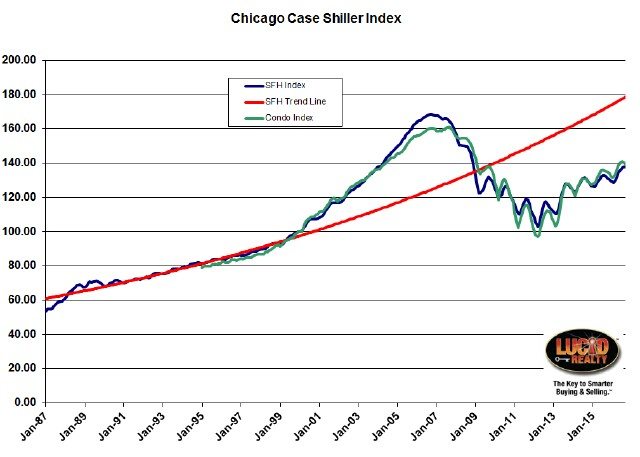
Based upon the home price index the nation’s home prices hit a record high. Yes, even surpassing the bubble peak in July 2006. But as you can see in the graph below Chicago has a long way to go still before we can make the same claim. In fact single family home prices in Chicago are still 18.2% below our peak and condos are 13.4% below their peak value.
From the bottom of the market single family home prices have risen 34.2% and condo prices have gained 43.3%. Relative to our bubblicious past single family home prices are below the entire period from March 2004 – December 2008 and condo prices are below the entire period of May 2004 – February 2009.
In the graph below I have constructed a trend line based upon the average growth rate in home prices prior to the housing bubble. Admittedly inflation was higher back then but obviously if we had been trending like the nation overall we would be almost on top of our trendline right now. As it is we are lagging it by 22.8%.
To put home price gains in a bit more perspective relative to inflation note that national home prices have risen at an annual real rate (above and beyond inflation) of 5.9% from the bottom of the market while real disposable personal income per capita has only risen by 1.3%. That is certainly not sustainable since in the long run the two metrics have to remain much closer but we are in a recovery phase here.
#ChicagoHomePrices #CaseShiller
Gary Lucido is the President of Lucid Realty, the Chicago area’s full service discount real estate brokerage. If you want to keep up to date on the Chicago real estate market, get an insider’s view of the seamy underbelly of the real estate industry, or you just think he’s the next Kurt Vonnegut you can Subscribe to Getting Real by Email using the form below. Please be sure to verify your email address when you receive the verification notice.

