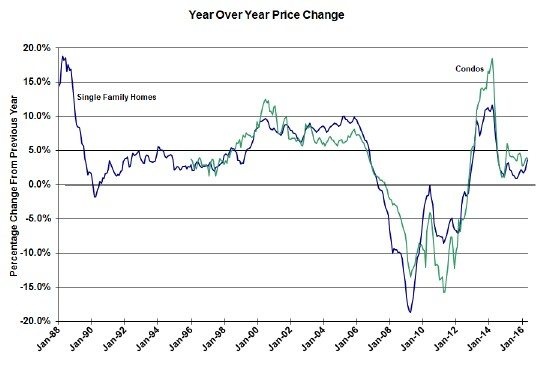
For quite some time now the Case Shiller Chicago home price index has been signaling pretty anemic year over year price gains – 20 months at or below 3%, which is well below the historic averages for Chicago and the rest of the country as well. However, lately it looks like the effects of our extraordinarily low home inventory levels have been starting to have a greater impact. This morning’s release of the May S&P CoreLogic Case Shiller indices showed the largest year over year gain for single family homes in 22 months at 3.7%. However, that still leaves Chicago ahead of only 3 cities out of 20 total.
Chicago condo prices registered a slightly stronger year over year gain of 3.9%, which was actually lower than last month’s 4.0%.
The graph below shows the long term trend in both of these metrics, which have now gone for 43 months in a row with gains. Meanwhile, the nation as a whole is running at 5.0% with Portland and Seattle still running at double digit gains.
David M. Blitzer, Managing Director and Chairman of the Index Committee at S&P Dow Jones Indices provided this perspective on the national picture:
In addition to strong prices, sales of existing homes reached the highest monthly level since 2007 as construction of new homes showed continuing gains. The SCE Housing Expectations Survey published by the New York Federal Reserve Bank shows that consumers expect home prices to continue rising, though at a somewhat slower pace. Regional patterns seen in home prices are shifting. Over the last year, the Pacific Northwest has been quite strong while prices in the previously strong spots of San Diego, San Francisco and Los Angeles saw more modest increases. The two hottest areas during the housing boom were Florida and the Southwest. Miami and Tampa have recovered in the last few months while Las Vegas and Phoenix remain weak. When home prices began to recover, New York and Washington saw steady price growth; now both are among the weakest areas in the country.
In contrast to the rest of the country Chicago’s gains have been much more modest – except for the huge surge during 2013 and early 2014 – and may only now be showing signs of greater strength.
Case Shiller Chicago Home Price Index By Month
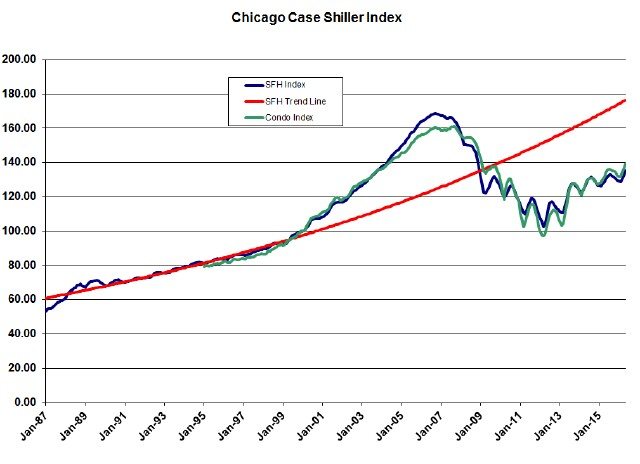
The graph below plots the underlying home price index values for Chicago single family homes and condos along with the long term trend line back to January 1987. As you can see there is little indication that we will ever close the gap with that long term trend. We are now 23.3% below that trend line.
Single family home prices were up 1.8% from April while condo prices were up 1.6%, both of which are smaller than April’s gain over March. But, as you can see in the graph below, there is an awful lot of seasonality going on. With these gains single family home prices have recovered a total of 31.7% from the bottom of the market in March 2012 and condo prices have recovered by 43.2%.
However, that still leaves single family home prices 19.8% below their peak and lower than they were during the entire period from November 2003 – December 2008. Condo prices are now 13.5% below their peak, which is lower than the period from May 2004 – February 2009.
#ChicagoHomePrices #CaseShiller
Gary Lucido is the President of Lucid Realty, the Chicago area’s full service discount real estate brokerage. If you want to keep up to date on the Chicago real estate market, get an insider’s view of the seamy underbelly of the real estate industry, or you just think he’s the next Kurt Vonnegut you can Subscribe to Getting Real by Email using the form below. Please be sure to verify your email address when you receive the verification notice.

