This morning’s release of the S&P CoreLogic October Case Shiller home price index shows the nation’s single family home prices hitting a new high and advancing 5.6% from last year. However, the picture for the Case Shiller Chicago home price index was not quite as rosy. The increase in area single family home prices from last year dropped back from a revised 4.2% in September to only 3.9% in October.
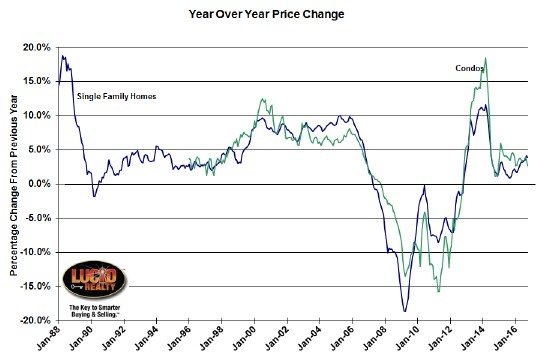
Similarly, the year over year gains in condo prices pulled back to 2.7% from 3.6% last month, which gives us the lowest 1 year gain in 9 months. However, at least we have 48 consecutive months of home price gains.
The graph below shows the year over year gains for both single family homes and condos in the Chicago metro area.

Home prices and the economy are both enjoying robust numbers. However, mortgage interest rates rose in November and are expected to rise further as home prices continue to out-pace gains in wages and personal income. Affordability measures based on median incomes, home prices and mortgage rates show declines of 20-30% since home prices bottomed in 2012. With the current high consumer confidence numbers and low unemployment rate, affordability trends do not suggest an immediate reversal in home price trends. Nevertheless, home prices cannot rise faster than incomes and inflation indefinitely.
After the S&P CoreLogic Case-Shiller National Index bottomed in February 2012, its year-over-year growth accelerated to a peak rate of 10.9% in October 2013 and then gradually fell to its current rate of approximately 5%. During the same period, the highest year-over-year rate from any city was 29% in August and September 2013; currently the highest single city gain declined to approximately 11%. Both national and city growth in home prices slowed but remains above the growth rate of incomes and inflation.
Case Shiller Chicago Home Price Index By Month
While the nation’s single family home prices actually rose 0.2% from September Chicago metro area prices fell 1.1%. While a drop is normal at this time of the year that was the biggest drop among the 20 metro areas tracked by S&P. New York and Detroit had the second largest drops with only a 0.2% decline.
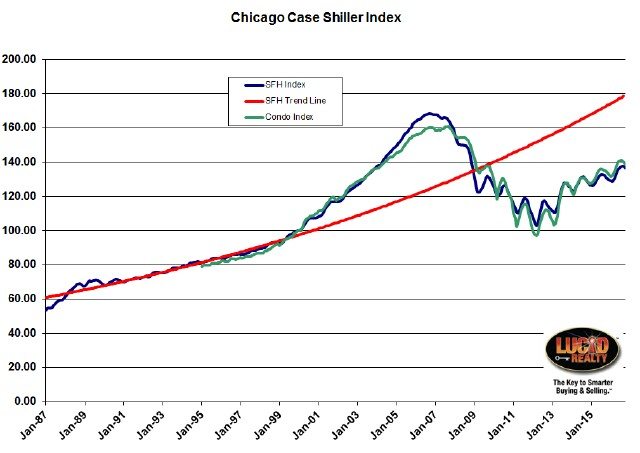
The graph below shows the monthly values of the Case Shiller Chicago metro area index for both single family homes and condos, which dropped 1.0% from September.
So, the nation’s home prices hit a new high but Chicago’s single family home prices are 19.1% below our peak and condos are 13.8% below the peak. However, single family home prices have bounced back 32.7% while condo prices have bounced back 42.6%. Yet, Chicago’s recovery not only lags the nation but it also lags it’s historic trend line by 23.9%. That trend line is graphed in red below based on the period prior to the housing bubble.
For historic perspective, single family home prices are still below where they were during the entire period from November 2003 through December 2008 and condo prices are still below their level from April 2004 through February 2009.
#ChicagoHomePrices #CaseShiller
Gary Lucido is the President of Lucid Realty, the Chicago area’s full service discount real estate brokerage. If you want to keep up to date on the Chicago real estate market, get an insider’s view of the seamy underbelly of the real estate industry, or you just think he’s the next Kurt Vonnegut you can Subscribe to Getting Real by Email using the form below. Please be sure to verify your email address when you receive the verification notice.
