Dow Jones S&P CoreLogic just released the January Case Shiller Chicago area home price index along with the indices for 19 other major metro areas and the nation as a whole. As has been the case for several years now single family home prices have been up on a year over year basis across the board. However, most of the nation continues to do better than Chicago.
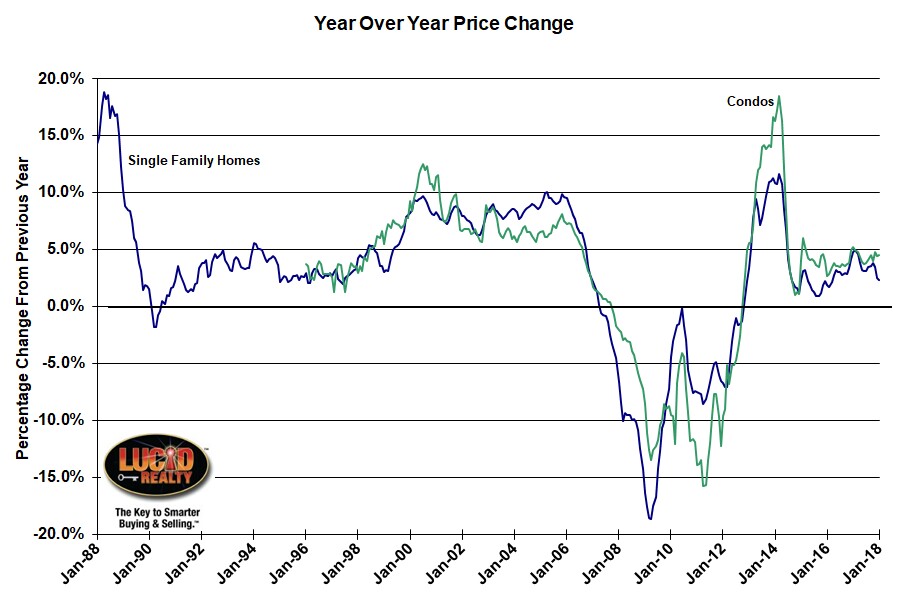
Three cities (Las Vegas, Seattle, and San Francisco) continue to clock double digit price appreciation and the 20 metro area average is up 6.4% over least year while the nation as a whole is up 6.2%. But woe is Chicago and DC which both appreciated by a measly 2.4%. And for Chicago that is the lowest year over year appreciation in almost 2 years – 22 months to be exact. However, January was the 63rd consecutive month of year over year appreciation.
Condo and townhome prices in the Chicago area did a bit better, appreciating by 4.6% from last year. You can see the entire history of annual home price appreciation for both single family homes and condos in the Chicago area in the graph below.

David M. Blitzer, Managing Director and Chairman of the Index Committee at S&P Dow Jones Indices, made several interesting observations about home prices:
Two factors supporting price increases are the low inventory of homes for sale and the low vacancy rate among owner-occupied housing. The current months-supply — how many months at the current sales rate would be needed to absorb homes currently for sale — is 3.4; the average since 2000 is 6.0 months, and the high in July 2010 was 11.9. Currently, the homeowner vacancy rate is 1.6% compared to an average of 2.1% since 2000; it peaked in 2010 at 2.7%. Despite limited supplies, rising prices, and higher mortgage rates, affordability is not a concern. Affordability measures published by the National Association of Realtors show that a family with a median income could comfortably afford a mortgage for a median priced home.
Well, that affordability statement must be based on national averages because we know that there are several metro areas that are NOT affordable.
Case Shiller Chicago Area Home Price Index By Month
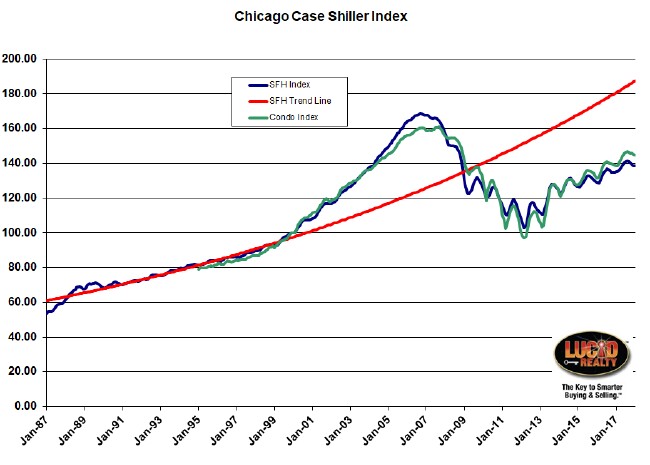
This next graph shows the actual monthly values for the Case Shiller Chicago area home price index going back to 1987. Single family home prices in January were flat from December and condo/ townhome prices fell by 0.4%, which is really just a seasonal effect.
Clearly we are still off from the bubble peak – by 17.9% for single family homes and 10.1% for condos and townhomes – in contrast to single family home prices for the nation as a whole, which are actually 6.3% above the peak. But our single family home prices have bounced back from the bottom by 34.7% with condos and townhomes jumping 48.8%. And our 34.7% recovery compares with a 46.5% bounce from the bottom for single family homes at the national level.
That means that our single family home prices are still below where they were during the entire period from February 2004 – December 2008 while condo/ townhome prices are still below their December 2004 – December 2008 level.
One other feature of the graph below is the red trend line based upon single family home price appreciation during the pre-bubble period and you will notice that it is now well ahead of the bubble peak. Our home prices are lagging that benchmark by 26.1%, which makes all of this statistical stuff even more depressing.
#ChicagoHomePrices #CaseShiller
Gary Lucido is the President of Lucid Realty, the Chicago area’s full service discount real estate brokerage. If you want to keep up to date on the Chicago real estate market, get an insider’s view of the seamy underbelly of the real estate industry, or you just think he’s the next Kurt Vonnegut you can Subscribe to Getting Real by Email using the form below. Please be sure to verify your email address when you receive the verification notice.
