Buffalo Grove Real Estate Market Trends
Buffalo Grove Real Estate Market Trends for Single Family Homes continued to improve in 2015 across all key measures. Here are the highlights with trend charts below:
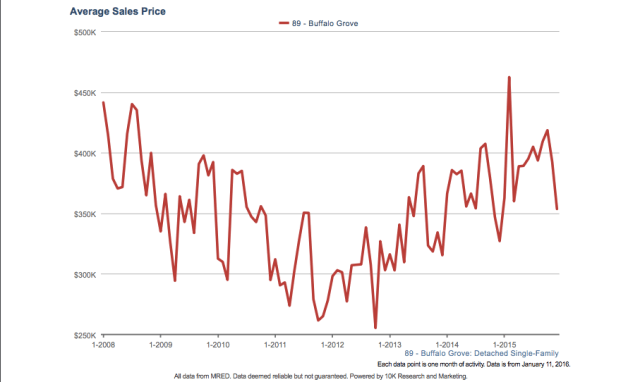
Average Sales Price
One of the Buffalo Grove Real Estate Market factors we reviewed was the average sales price for single family homes and that number increased in 2015 to $392,590, a 5.9% improvement over the 2014 figure of $370,715.
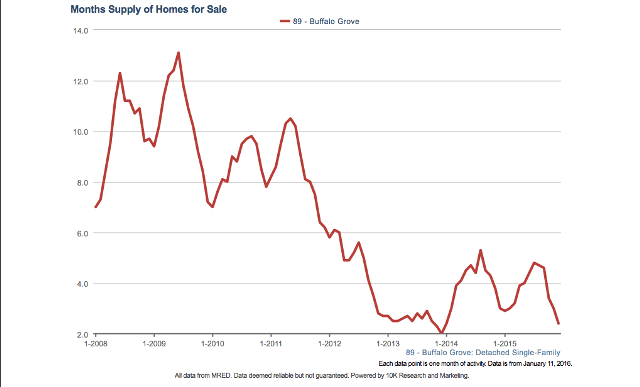
Months of Supply of Homes for Sale
From an inventory perspective, average Months of Supply of Homes for Sale continues to decline to 3.7, a 9.3% change from the average of 4.0 in 2014. Great for sellers, not so great for buyers.
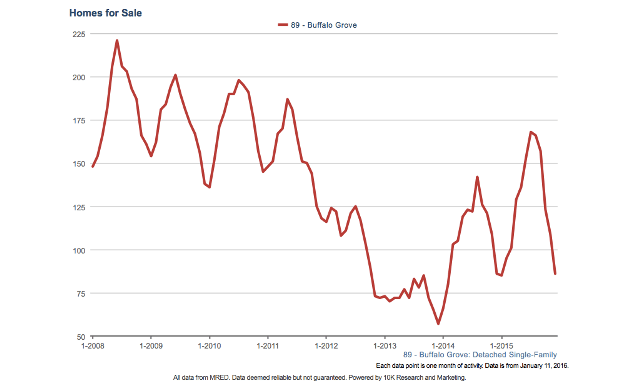
Buffalo Grove Single Family Homes for Sale
Buffalo Grove Single Family Homes for Sale ended 2015 at 86, a low figure, given 61 homes closed in July alone. 419 Homes were Sold in 2015, which is 85 more than 2014 or +20%. This is twice as many that sold in 2008 and 2009!
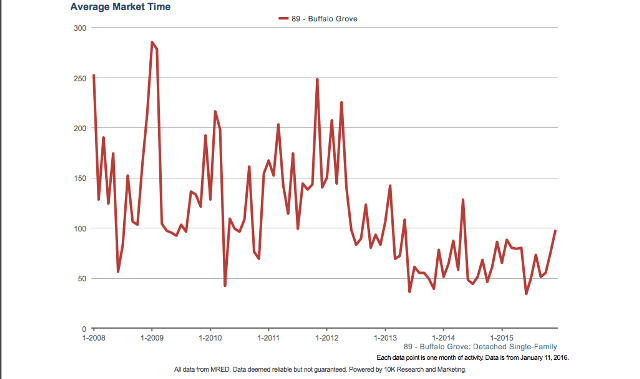
Average Market Time
We are also seeing nice improvement in Average Market Time at 66 days with a low mark of 34 days in June; excellent when compared to 250+ days 2009. Average Market times in Buffalo Grove were the lowest of any Chicago suburb in 2015!
Buffalo Grove Real Estate Market – 2015 Condos and Townhomes
Buffalo Grove Real Estate Market for condo and town homes continued to improve in 2015 across all key measures. Here are the highlights with trend charts below:
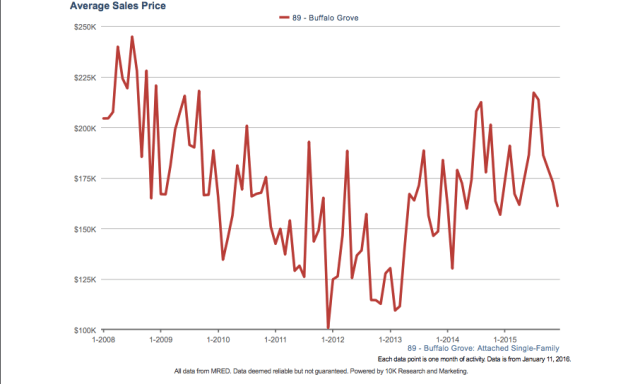
Average Sales Price
The average sales price in Buffalo Grove increased in 2015 to $185,720, a 3.6% improvement over the 2014 figure of $179,068.
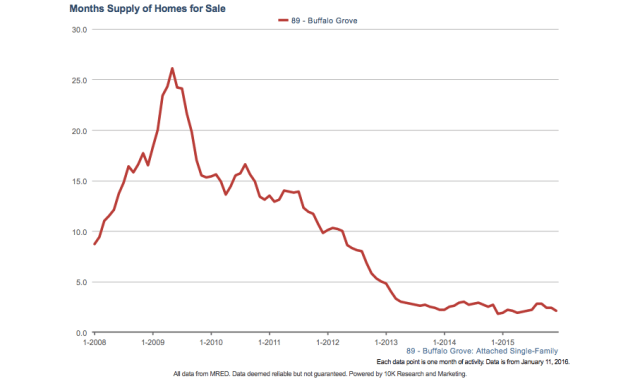
 Months of Supply of Home for Sale
From an inventory perspective, Months of Supply continues to decline to an amazing average of 2.2, a 16.8% improvement from the average of 2.6 in 2014.
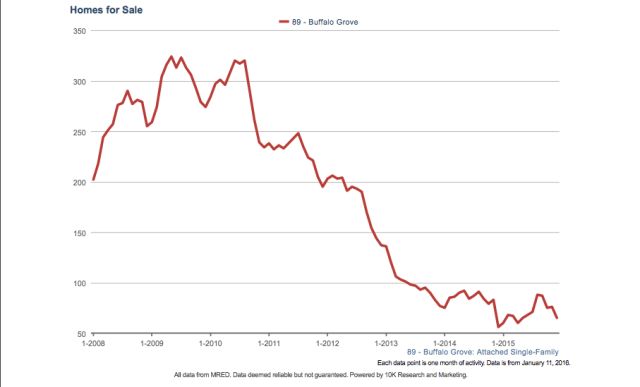
Buffalo Grove Condos and Townhomes for Sale
The number of Buffalo Grove Condos and Townhomes for Sale ended 2015 at 65, a low figure, given 60 homes closed in July alone.
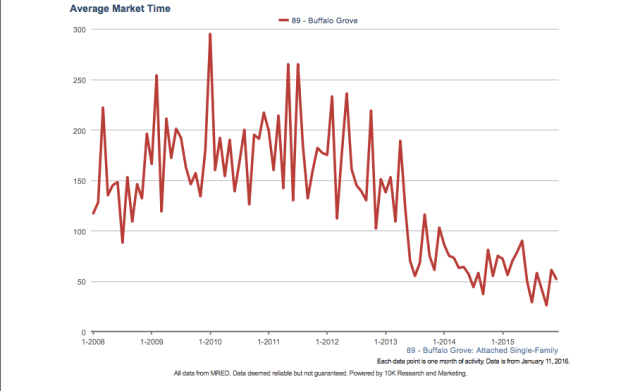
Buffalo Grove Condo and Town home Average Market Time
We also saw a nice improvement in which ended 2015 at 57 days , the low mark was 26 days at the end of October. Again, the lowest average market time of all Chicago Suburbs!
Similar to the Single Family Home Market, inventory is shrinking. More homes are selling and selling more quickly! In addition, Condo and Town home inventory is getting tight. This should provide an excellent opportunity for Sellers! Article authored by Eddie Nusinow of Lucid Realty.
0 thoughts on “Buffalo Grove Real Estate Market: A Look at 2015”