Last week’s release of the Case Shiller home price index showed a continued slowdown in the annual rate of change in home prices for Chicago. A little more than 2 weeks ago Zillow/ Pulsenomics released their latest quarterly forecast for national home prices based upon the outlooks of their panel of 107 so-called real estate experts.
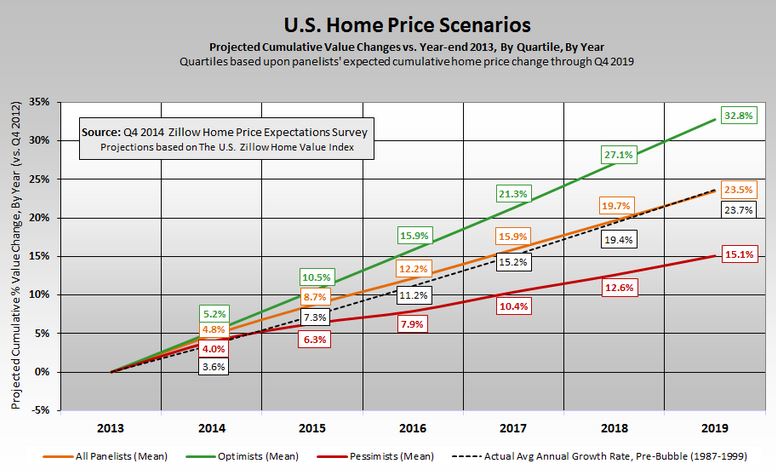
This release extends their forecast into 2019 for the first time and the graph below shows that on a cumulative basis the experts expect 23.5% price appreciation over the 6 year period beginning in 2013. That still works out to 3.6% per year compounded.
The cumulative forecast through 2018 is now 19.7% appreciation vs. 19.5% last quarter so the experts are slightly more optimistic over the 5 year period.
Note that the average anticipated annual appreciation is higher than the effective after tax cost of interest on your mortgage. In other words, if you own a house your mortgage is essentially free.
When asked what the single biggest threat to the long term stability of the housing market was the top choices of the panelists were 1) shifting demographics and 2) the financial weakness of first time homebuyers. The shifting demographics has to do with young people delaying marriage and having children and older people staying in their homes longer for a variety of reasons, including the fact that they may be underwater on their mortgage.
On the financial side first time homebuyers are strapped by high rents that make it difficult to save a down payment, and mortgages are harder to get than they used to be.
Outlook For Chicago Area Home Prices
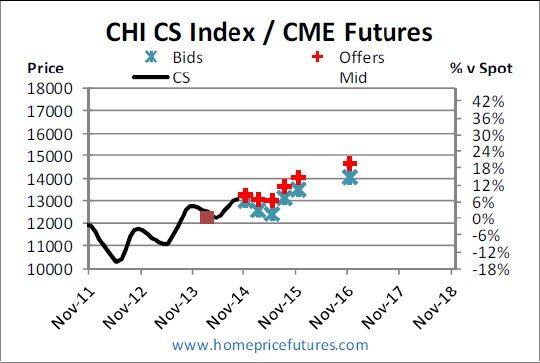
Since Zillow/ Pulsenomics doesn’t produce a Chicago specific home price forecast I like to look to the Case Shiller Home Price Index Futures market for insight into where home prices are heading. The only problem is that these markets are so thinly traded that the data is pretty sketchy – so sketchy that I can’t currently obtain data beyond 2016.
I was waiting for John Dolan’s November review but so far all I can find is his October review, from which I obtained the graph below. The furthest out point is for the November 2016 contract, which represents the September 2016 release. The midpoint is 143.5, which implies a total of 9.3% appreciation over the two year period. That works out to 4.5% per year over the next two years – a bit more optimistic than the Zillow/ Pulsenomics forecast.
On Monday I’ll be posting my November Chicago real estate market update. It looks like sales fell quite a bit last month but, again, it’s going to be largely attributable to the decline of distressed sales. Non-distressed sales did pretty well.
#homepriceforecast
If you want to keep up to date on the Chicago real estate market, get an insider’s view of the seamy underbelly of the real estate industry, or you just think I’m the next Kurt Vonnegut you can Subscribe to Getting Real by Email. Please be sure to verify your email address when you receive the verification notice.

