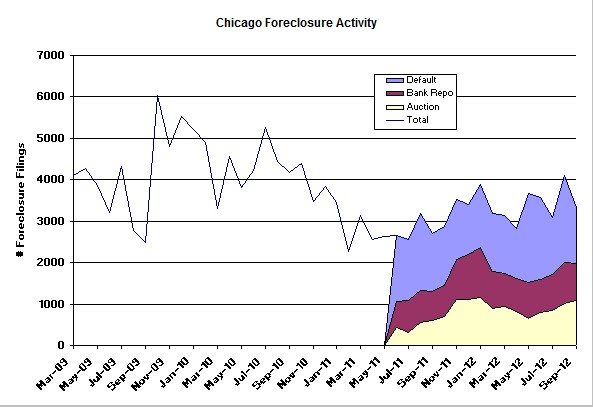
With today’s release of RealtyTrac’s September foreclosure activity report you will see headlines claiming that we just saw a 5 year low – but that’s at the national level. Meanwhile, all you have to do is look at the long term chart below for Chicago foreclosure activity and you can see that it’s anything but a 5 year low. Yes, September was down from August but for 9 months straight now the foreclosure activity has been higher than the previous year. Given the volatility in the month to month numbers and the lack of a clear seasonal pattern I don’t really pay much attention to the month to month or year over year changes but when you see several months in a row all moving in the same direction from last year it’s worth noting.

Commenting on the national picture, Daren Blomquist, vice president at RealtyTrac, said:
We’ve been waiting for the other foreclosure shoe to drop since late 2010, when questionable foreclosure practices slowed activity to a crawl in many areas, but that other shoe is instead being carefully lowered to the floor and therefore making little noise in the housing market — at least at a national level. Make no mistake, however, the other shoe is dropping quite loudly in certain states, primarily those where foreclosure activity was held back the most last year.
RealtyTrac points out that the judicial foreclosures states (where a court process is required) are more likely to be showing increases in foreclosure activity over last year. Presumably this is because the process was put on hold during the foreclosure processing scandal a while back and that created a backlog that is only now being worked through. Since Illinois is a judicial foreclosure state we are probably seeing the result of that. It looks like Crain’s was able to get some more perspective from Daren on what is going on with foreclosures in Illinois:
I think that the majority of the foreclosures that we’re seeing now, under normal circumstances . . . would have actually happened in 2011 or in late 2010, but they’ve been pushed into 2012, which is resulting in these increases that we’re seeing. I think (the Illinois numbers) will go up as some of those delayed foreclosures are pushed through . . . but I think in the next few quarters, you’ll actually see that turn a corner.

As Daren Blomquist points out:
It was a little surprising that the national time to foreclose kept going up even though we’re seeing nationwide foreclosures decrease. It does make me wonder if there’s still some kind of hidden distress out there that the banks have not yet dealt with in some of these states.