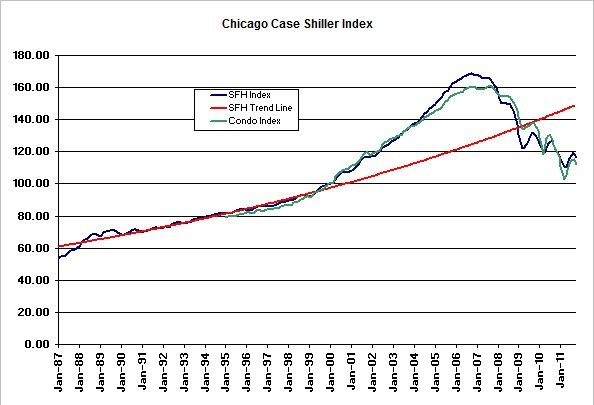
The Case Shiller Home Price Index just came out and it shows a continued decline in Chicago home prices in October. If you will recall prices had been rebounding for several months – for the third time. Then starting in September they turned around. Now in October this quadruple dip is starting to take shape, which is actually quite incredible given that prices are still more than 22% below the long term trend line plotted below in red.
Chicago single family home prices fell an additional 1.8% in October, bringing the price index 31% below the bubble peak in September 2006 and back to the levels of August/September 2001. On a year over year basis home prices are down 4.8% but that year over year decline is getting smaller – for now. However, I do need to point out that prices are at least still up 5.7% from the recent low reached in April of this year.
Meanwhile, condominium prices in Chicago plunged 2.5% from September, which means they are down 7.7% in the last year. Chicago condo prices are down a total of 30.2% from the bubble peak and they are back to the level of April 2001.
As Standard and Poors noted in their Case Shiller index press release the hardest hit markets in October were some of the strongest during the spring and summer buying season.

If you are interested we maintain a page of on our Web site that contains this home price data along with numerous other Chicago real estate market data all in one place. Actually, even if you are not interested we still maintain this page.
0 thoughts on “Chicago Home Prices Continue Falling In October”
Leave a Reply
You must be logged in to post a comment.
The values go down and the property taxes go up.
Only in Chicago!
Well, it really highlights the need to appeal your tax valuation because a lot of properties are overvalued by the assessor.
I think understanding the shift happening now will require a greater timeline than 1987 to current.
Check out a longer term, inflation adjusted chart: http://www.ritholtz.com/blog/wp-content/uploads/2011/04/2011-Case-SHiller-updated.png
Yes, I’m familiar with that data. Basically what it says is that home prices rise at about the rate of inflation. The trend growth in prices shown in my chart from 1987 is basically equivalent to the rate of inflation – about 3.7% per year.